Now and again we get a slightly panicky call from one of our clients as they attempt to execute some part of their application and it takes far longer to run than it should, or than it did the last time it was executed. Our first question is usually “have you run REORGs and RUNSTATS recently ?” and the answer is often “yes, of course we have”. The trouble is, occasionally, that there has been considerable activity since these utilities were executed. We’re often told that it’s only been 24 hours (or 12 or even 2) since they were run but, on closer examination, it turns out that a lot has happened in that elapsed time.
Now the optimizer is a very clever piece of software (in fact, I reckon it’s approaching a level of complexity that could be interpreted as Artificial Intelligence) but it can only work with what it’s given. If it’s asked to get data from a table and the values stored in the system catalogs indicate a very low volume of data, it’ll define an access path accordingly. If you’ve loaded hundreds of thousands, or millions of rows of data since the last RUNSTATS, it won’t have any visibility of that and will end up choosing a sub-optimal access path.
It’s almost better if RUNSTATS hasn’t been run at all; if the optimizer is presented with catalog data where the values are all -1 and the STATS_TIME is still NULL, it’ll know that no RUNSTATS have been completed and it’ll make an educated guess about the access path that’s needed; and often a pretty good guess. But if it’s presented with a list of values and it’ll trust these values to be reasonably accurate.
So, rather than asking the user if they’ve run RUNSTATS, maybe give them the option of comparing the actual figures with what RUNSTATS found when it last ran.
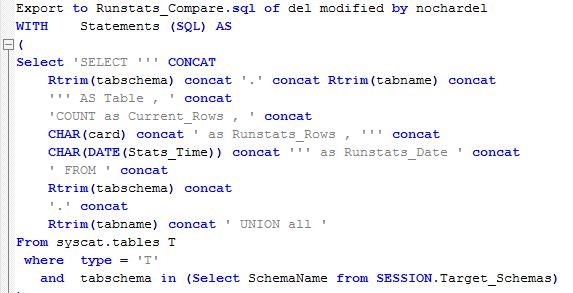
The SQL to do this is basically in 2 parts
1. You have some SQL executing against SYSCAT.TABLES to write a new script, which will run against each table in the schema you specify, but which has the existing stats embedded in it
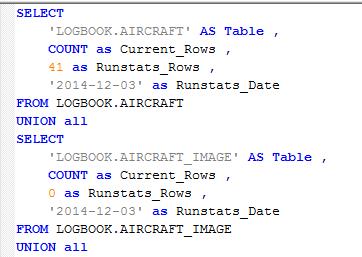
That looks a bit horrendous but what you actually get out of it is a line for each table in the schema that looks like this (just showing the rows for the first couple of tables here):
2. You then run this script and it will return the embedded RUNSTATS data plus the counts from the tables you nominated
In this case the numbers match, but you can see how this would highlight any discrepancy. You could even suck the output data into an Excel spreadsheet or similar and do something fancy to determine by what percentage the RUNSTATS values are ‘out’ and highlight anything that was + or – 10% or so.
It’s not rocket science but it can be a handy way of quickly getting the data to show to the users when this sort of query arises.
And it might keep the T-800s off your back when the Optimizer becomes self-aware and turns on humanity.
If you would like a copy of a Stored Procedure that will provide this output, then please contact Mark Gillis directly.


